S&P 500 Forecast: Analysing Prospects for the End of 2023

9 minutes for reading
The S&P 500 index (US500) reached 4415.00 points on 13 November, marking a 14.5% increase since the beginning of the year. However, there is a 4.2% decline from the peak of 4600.00 points reached on 27 July 2023. In this article, we will explore whether the index has any chance of reaching a new high by the end of 2023.
We will analyse the key financial factors of the US economy influencing S&P 500 behaviour. Additionally, we will conduct a technical analysis of the index chart and present expert forecasts for Q4 2023 and the full year 2024.
How inflation and the Fed's actions may influence the S&P 500
In March 2020, the US Federal Reserve System (Fed) announced the launch of the Quantitative Easing (QE) programme, a credit and monetary policy that could promote economic growth, employment, and inflation but can also lead to negative consequences such as financial bubbles, increased debt, and hyperinflation.
As part of QE, the purchase of government bonds, mortgage-backed securities, corporate bonds, and other assets on the market began. The programme aims to keep interest rates low, stimulate consumption and investment, and prevent deflation and recession.
The US first used the quantitative easing programme in 2008, after the financial crisis. This helped the country's economy overcome its consequences and return to growth.
It is time to ask about the connection between QE and the S&P 500. Let us try to explain. Injecting money into the economy tends to stimulate demand for goods and services, creating favourable conditions for companies to increase their profits. This, in turn, usually positively impacts their stock prices, ultimately prompting a rise in the S&P 500 index.
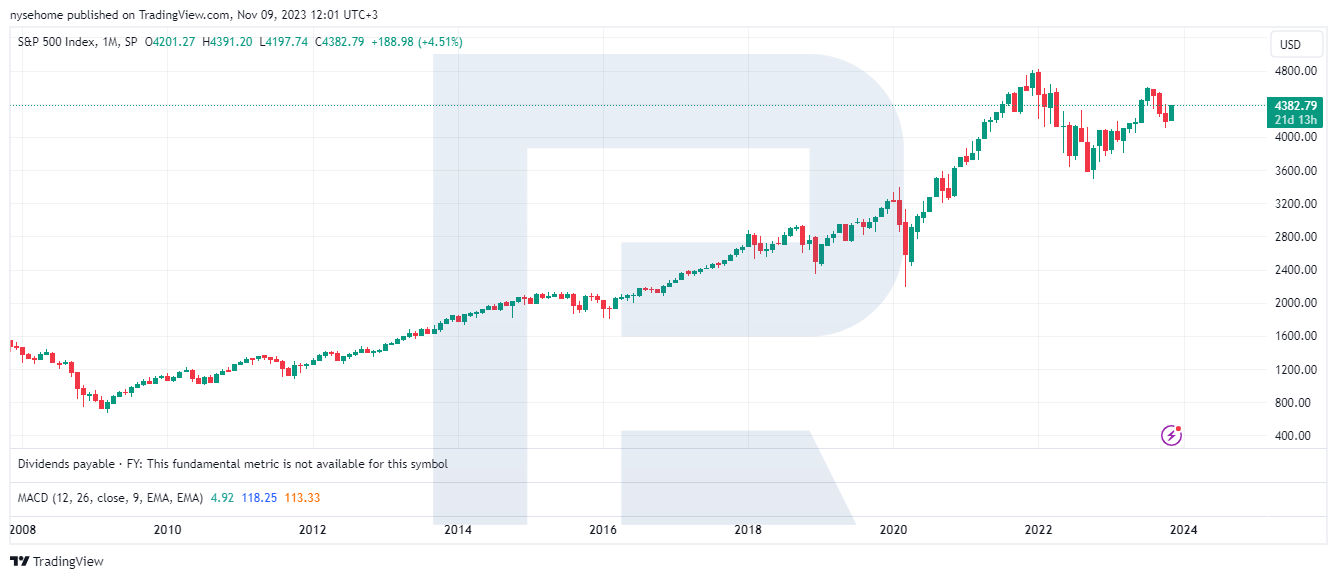
Below are two charts: the S&P 500 in August 2008-October 2003 inclusive, and the United States Central Bank Balance Sheet in October 2007-October 2023 inclusive. The second chart reflects the QE size.

The CB balance gradually shrinks once the QE programme is over, indicating that the country's economy no longer needs stimulation and can continue rising without additional support. Currently, the Fed typically focuses on maintaining annual inflation below 2%. If it exceeds this target, the regulator cools the economy through quantitative tightening (QT), which involves raising the interest rate.
In 2020, an unprecedented QE programme was conducted, which led to an increase of over 5 trillion USD in the Central Bank balance. Comparatively, from 2008 to 2019, this index rose by about 3 trillion USD.
A sharp surplus of money supply in the US economy resulted in inflation skyrocketing. In June 2022, it reached 9.1%, exceeding the records of the last 50 years. To combat inflation, the Fed took a path that was already familiar: in March 2022, it initiated a QT cycle, reducing the Central Bank balance.
As a result, by October 2023, inflation had dropped to 3.7%. However, recall that the target level is 2%, which means the Fed still has a reason to continue tightening monetary policy. This, in turn, suggests the economy may still be growing, with the regulator aiming to cool it down.
US GDP in 2023
The increase in the US economy is confirmed by GDP data, with the growth rate, according to Trading Economics, rising by 4.9% in October 2023. These two indices from October 2020 to October 2023, inclusive, can be seen in the two charts below.

In Q2, an unprecedented 12% rise in GDP occurred, followed by a surge in inflation. In 2022, a cycle of interest rate hikes and a QT programme created conditions for a slowdown in Q4 2022 GDP growth to 0.7%. Next, inflation also sped down.
However, GDP growth has steadily increased in the first three quarters of 2023, providing a basis for a possible further rise in inflation. Note that it saw an increase from the low of 3% in June 2023 to 3.75% in October. Inflation growth could be another reason for the Fed to tighten the credit and monetary policy.


US citizens’ spending and debts
Why does the economy continue to grow despite high inflation? The question can be answered by studying consumer spending. When consumers notice prices of goods and services rise, they tend to make purchases they had postponed because they realise that the desired goods might become even more expensive in the future. This results in money not going to deposits, for example, but is spent instead, positively influencing the demand for goods and services.
However, if consumer income does not grow, the potential for economic growth diminishes rapidly. Another option to keep spending at a high level is using borrowed money. However, this increases consumer debt and is not sustainable. See below the consumer spending data from October 2013 to September 2023 inclusive, indicating record levels.

Despite the anticipated effect of rising prices on cooling consumer demand, consumer enthusiasm has not waned. At the same time, to sustain spending growth, consumer income also needs to increase. According to Trading Economics, Americans' personal income rose by 0.3% in September 2023 compared to August values. Simultaneously, the US Consumer Price Index (CPI) added 0.4%, which suggests that consumers are either spending their savings or using borrowed money, or both.
The chart below shows changes in Americans' personal savings and credit card debts from November 2013 to October 2023 inclusive. It is evident that, in 2023, the personal savings of US citizens dropped to the lowest levels in the last decade, and credit card debt reached 1 trillion USD, an all-time high. This information suggests that the rise in consumer demand may soon be over, posing risks for further growth of the economy and the S&P 500 index accordingly.

Industrial production, bankruptcy of companies, and crude oil prices
WTI quotes have fallen by 15.5% since 20 October 2023, despite a decrease in crude oil production by OPEC countries. This typically indicates declining demand for black gold, a trend often observed when industrial production volumes decrease. The chart below presents US industrial production data from January 2020 to September 2023 inclusive. As you can see, the growth is approaching the zero level.

The tightening of the Fed's monetary policy has increased loan costs, potentially resulting in growing bankruptcies among currently vulnerable companies. Below is information regarding the number of bankruptcies in the US from Q4 2020 through Q3 2023 inclusive. The diagramme indicates a gradual increase, with growth starting four months after the regulator raised the interest rate for the first time.

The increase in the number of bankruptcies might lead to rising unemployment, and statistics are beginning to confirm this idea. According to Trading Economics, from July to October 2023, the unemployment rate rose from 3.5% to 3.9%. This is not critical unless it marks the beginning of a new uptrend.

S&P 500 index analysis
On 3 November 2023, the S&P 500 index quotes crossed the trendline, returning to an ascending channel. On 10 November, they surpassed the resistance level at 4385.00 points, increasing the probability of further growth and a possible end to the correction. The next resistance level might be the 4500.00 mark. If the quotes manage to get over this level, they might reach an annual high of 4600.00 points. If the quotes drop below the ascending trendline, the growth scenario will be cancelled. If so, they could return to the support level of 4200.00 points.
S&P 500 YTD return 2023
Since the beginning of the year, the S&P 500 has risen by 14.5%. The most significant increase occurred in June - by 6.2%. The worst month was September, when the quotes dropped by 4.8%.

Expert forecasts for the S&P 500 in 2023-2024
BofA Global Research forecasts that the S&P 500 could end 2023 at the 4600 mark. This forecast exceeds the previous prediction of 4300.
Barclays experts suggest three scenarios for the end of 2023:
- The bullish forecast presumes a rise in the index to 4700 points and a perfect landing for the US economy.
- The base forecast suggests a movement of the S&P 500 index to 4150 points and a soft landing for the US economy.
- The bearish forecast implies a decline of the index to 3650 points and a minor recession.
For 2024, they also have three possible vectors of the index movement:
- The bearish forecast implies a rise to 5200 points.
- The base forecast suggests a movement to 4500 points.
- The bearish forecast presumes a decline to 3800 points.
Marko Kolanovic from JPMorgan Chase & Co expects the S&P 500 index to reach 4200 points by the end of 2023. He believes that the stock market is ready to disappoint investors in the nearest months and next year because, he states, the evaluations of the index dynamics that suggest growth are excessively optimistic.
UBS analysts forecast that by mid-2024, the S&P 500 index will have reached 4500 points and 4700 points by the end of the year.
Morgan Stanley expects the S&P 500 to reach 4500 points by the end of 2024.


Summary
The US economy is growing, and it is difficult to predict when this upward phase will be over. Americans' credit debts could easily continue rising. In such circumstances, the S&P 500 index could reach 4500 points by the end of the year.
It is worth noting that Q4 is the time of holiday sales and the New Year rally of the S&P 500. Moreover, note that the US presidential election is scheduled for 2024. The current government aims to approach it positively, which could also create supportive conditions for the index.
However, with data on company bankruptcies, industrial production, and the unemployment rate, such growth seems fragile. The all-time high public debt that needs maintenance reinforces this impression.
* – Past performance is not a reliable indicator of future results or future performance.
The material presented and the information contained herein is for information purposes only and in no way should be considered as the provision of investment advice for the purposes of Investment Firms Law 87(I)/2017 of the Republic of Cyprus or any other form of personal advice or recommendation, which relates to certain types of transactions with certain types of financial instruments.
The TradingView platform supplies the charts featured in this article, offering a diverse array of tools for analyzing financial markets. This high-tech online market data charting service provides a convenient platform for users to engage in technical analysis, research financial data, and communicate with other traders and investors. Additionally, it offers valuable guidance on how to use a stock screener effectively, along with insights into other financial assets.


 are complex instruments and come with a high
  of losing
  rapidly due to
  . 69,88% of retail investor accounts lose
  when trading
  with this provider. You should consider whether you understand how CFDs work and whether you can afford to take the high