Top 3 Largest IPOs in 2023
10 minutes for reading
The US IPO market has failed to impress for the second consecutive year. According to Bloomberg, the total funds raised amounted to 11 billion USD in 2022, excluding SPACs, and reached 21 billion USD in 2023. By comparison, based on PwC data, this indicator soared to 323 billion USD in 2021.
September delivered the best results this year, raising 7.3 billion USD. It is worth noting that this performance marks a record since 2021, when the Federal Reserve embarked on substantial tightening of monetary policy, contributing, among others, to a further decline in IPO market activity.
Today, on 29 November 2023, we will discuss the top 3 largest IPOs in 2023. Companies such as Arm Holdings plc., Maplebear Inc., and Klaviyo Inc. garnered the most considerable proceeds when going public.


1. IPO of Arm Holdings plc. – 4.87 billion USD
Year of registration: 1990
Registered in: the UK
Headquarters: Cambridge, Cambridgeshire
Sector: technology
Market capitalisation: 63.78 billion USD
Microprocessor manufacturer Arm Holdings plc. (NASDAQ: ARM) conducted its IPO on 13 September 2023, with Goldman Sachs & Co. LLC, J.P. Morgan Securities LLC, BofA Securities Inc., Barclays Capital Inc., and Citigroup Global Markets Inc. as the largest underwriters. The issuer sold 95.5 million ordinary shares at an average price of 51 USD per unit, reaching gross proceeds of 4.87 billion USD. At the time of writing, the stock traded at 62.21 USD.
The P/S multiple (the ratio of capitalisation to proceeds) was 23.8 at the IPO date, while the sector’s average ratio stood at 8.10. Arm Holdings plc.’s multiple value shows that the company’s valuation is high, implying limited potential for stock growth.
Investments raised (as at 30.06.2023) amount to 1.28 billion USD.
The principal investor is SoftBank Group Corp.
Arm Holdings market assessment
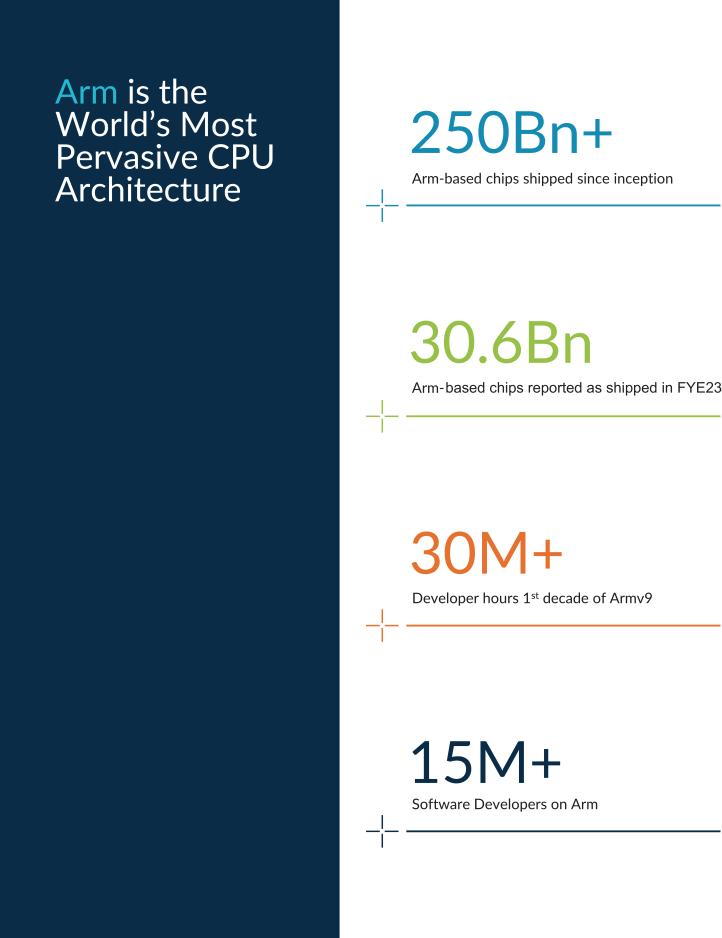
Arm Holdings plc. designs, manufactures, and licences a wide range of energy-efficient and high-performance semiconductor products used in smartphones, tablets, laptops, PCs, servers, cars, and other electronic devices.
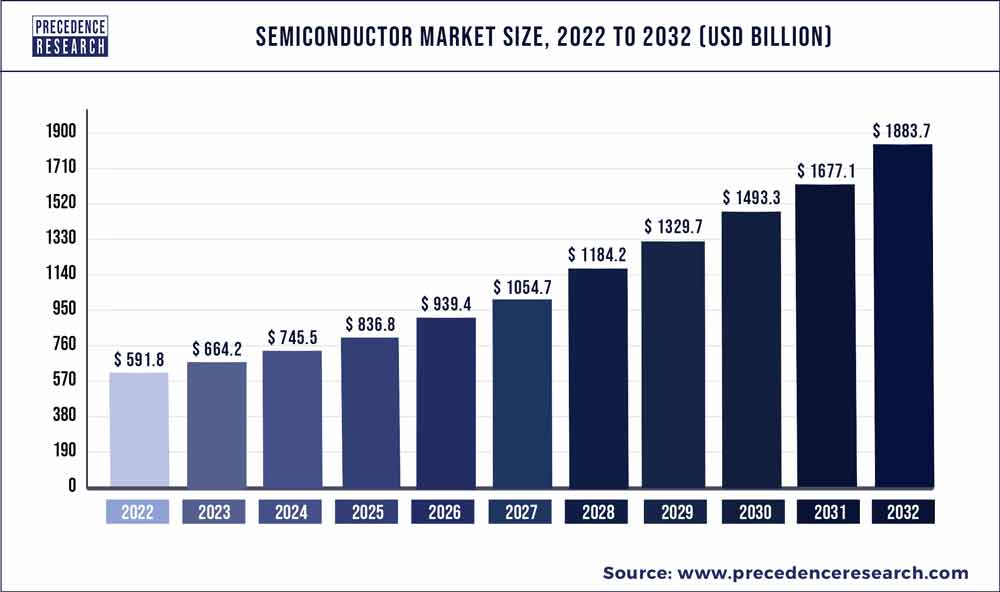
According to a report by Precedence Research, the global semiconductor market was valued at 592 billion USD, with the potential to reach 1.88 trillion USD by 2032. The compound annual growth rate from 2022 to 2032 inclusive is 12.28%.
Arm Holdings' primary competitors:
- Broadcom Inc.
- Qualcomm Incorporated
- Intel Corporation
- Micron Technology Inc.
- Samsung Electronics Co. Ltd.
- Texas Instruments Incorporated
- SK Hynix Inc.
Financial performance of Arm Holdings
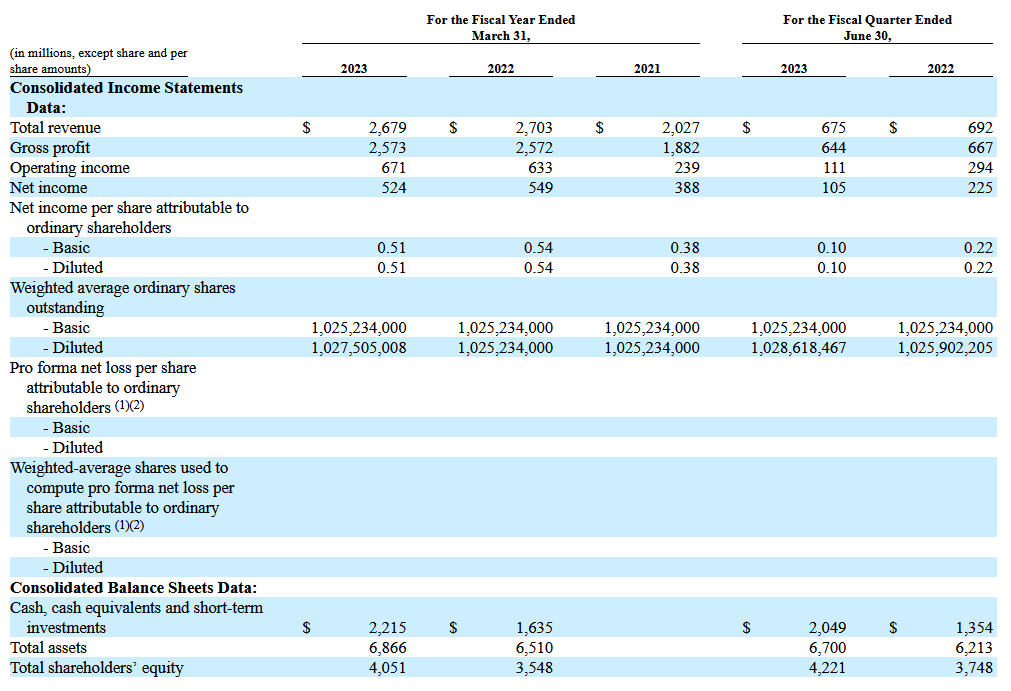
- Revenue for fiscal 2023 (01.04.2022-31.03.2023): 2.68 billion USD, −0.89%
- Net profit for fiscal 2023: 524 million USD, −4.55%
- Net cash flow (as at 30.06.2023): 778 million USD
- Cash and cash equivalents (as at 30.06.2023): 2.0 billion USD
- Liabilities (as at 30.06.2023): 2.5 billion USD
Analysts’ forecasts for Arm Holdings stock for 2023-2024
- According to Yahoo Finance, Wells Fargo experts rated Arm Holdings plc.’s stock as Overweight with a price target of 70 USD. Their optimism is attributed to hopes of the tech company increasing its market share in China in 2024
- In a comment to Barron’s, BofA Securities analyst Vivek Arya noted that Arm Holdings plc.’s stock might reach the 65 USD mark in the medium term and recommended it as a Buy
- According to Investing, KeyBanc Capital experts gave Arm Holdings plc.’s stock an Overweight rating with a 65 USD price target. They believe that computing requirements across mobile devices and data centres become increasingly more demanding and complex, which will only increase the global reliance on the company’s developments, ultimately resulting in higher revenues in 2024-2025
Technical analysis of ARM Holdings stock
On 23 November 2023, Arm Holdings plc.’s stock gained a foothold above the upper boundary of the Head and Shoulders reversal pattern. Presumably, the pattern target could be 66.00 USD. At the time of writing, the stock is correcting following a rebound from the resistance level of 63.00 USD.
There still seems to be potential for the formation of a trend continuation pattern, the Bullish Flag, with the 72.00 USD level acting as a probable pattern target. For the pattern to be formed entirely, buyers must gain a foothold above 63.00 USD, which might indicate a possible breakout of the upper pattern boundary.
A rebound from the ascending trendline on the RSI can serve as an additional signal confirming a potential bullish scenario. A negative scenario for buyers could be a price drop below 59.00 USD, which might trigger a decline to the support level of 55.60 USD.
Technical analysis of ARM Holdings stock*


2. IPO of Maplebear Inc. (Instacart) – 660 million USD
Year of registration: 2012
Registered in: the US
Headquarters: San Francisco, California
Sector: consumer cyclical
Market capitalisation: 7.15 billion USD
Maplebear Inc. (NASDAQ: CART), the owner of Instacart grocery delivery and online purchase service, went public on 19 September 2023. Goldman Sachs & Co. LLC, J.P. Morgan Securities LLC, BofA Securities, Inc., Barclays Capital Inc., and Citigroup Global Markets Inc. were the main underwriters.
Maplebear Inc.’s offering volume was 22 million ordinary shares with an average price of 30 USD per unit, resulting in gross proceeds of 660 million USD. At the time of writing, Maplebear Inc. shares are trading at 25.51 USD.
At the time of the IPO, the company’s P/S multiple stood at 3.41, while the average value across the sector was 2.09. This makes it possible to assume that the issuer’s valuation is close to average market values, with the stock having moderate potential for growth.
Investments raised (as at 30.06.2023) amounted to 3.75 billion USD.
The main investors are Sequoia Capital and D1 Capital Partners L.P.
Maplebear market assessment
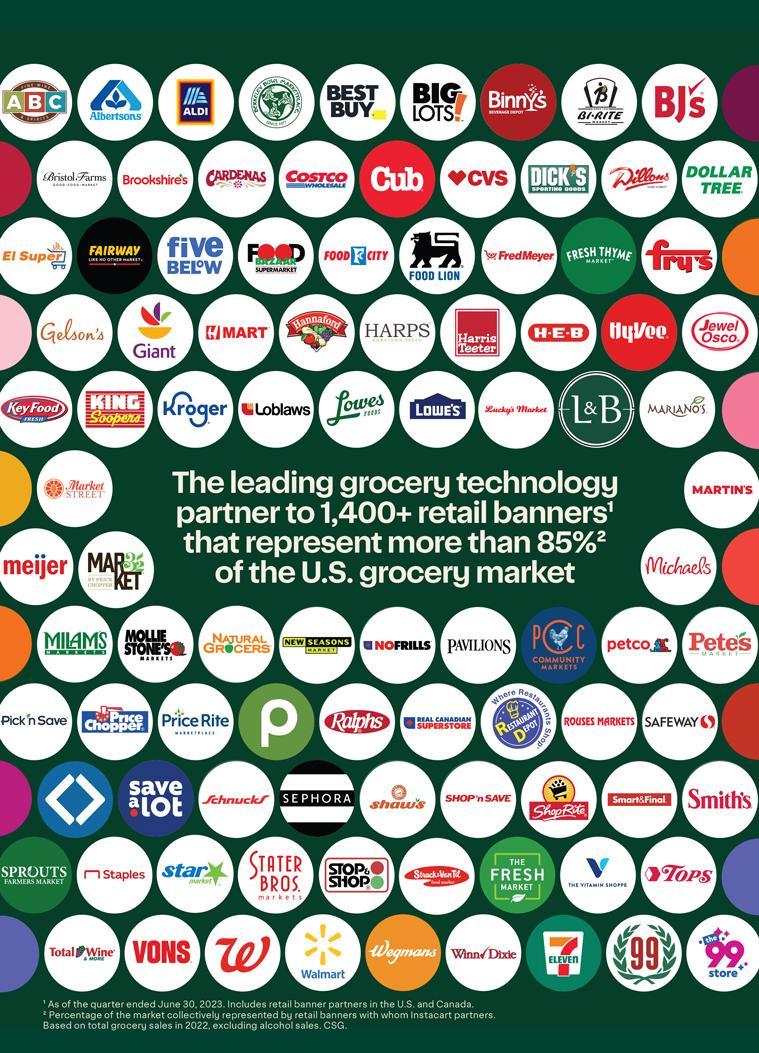
Maplebear Inc. collaborates with 1,400 retailers, covering over 85% of the US market. According to a report by Grand View Research, the global online grocery market was valued at 50.28 billion USD in 2022. It is projected to reach 305.13 billion USD by 2030, with a compound annual growth rate of 26% from 2023 to 2030.
Maplebear’s primary competitors:
- Walmart Inc.
- Uber Technologies Inc.
- Amazon.com Inc.
- Criteo S.A.
- Blue Apron Holdings, Inc.
- Target Brands Inc.
- Natures Basket Limited.
Financial performance of Maplebear
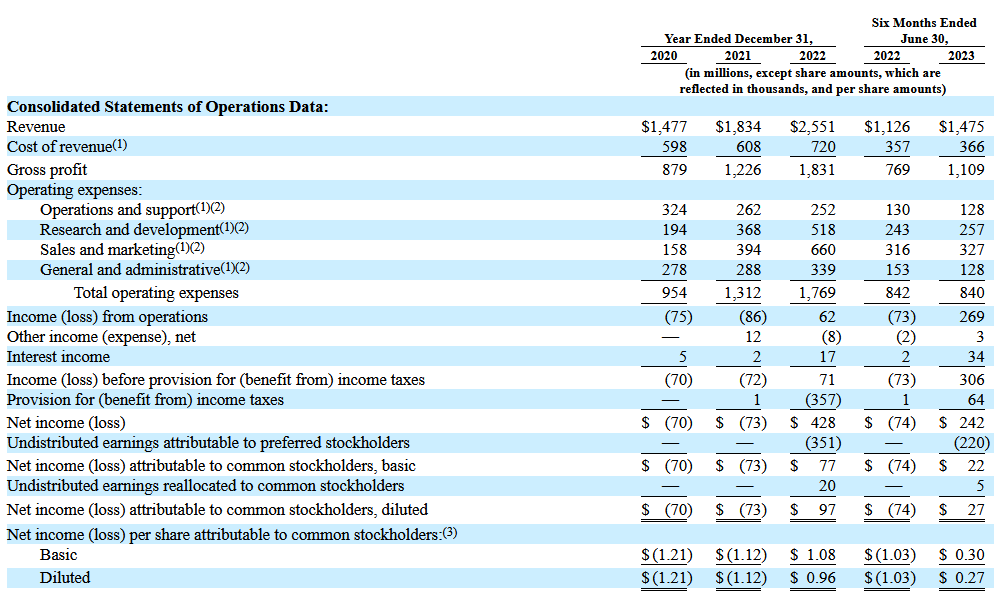
- Revenue for 2022: 2.55 billion USD, +39.1%
- Net profit for 2022: 428 million USD
- Net cash flow (as at 30.06.2023): 387 million USD
- Cash and cash equivalents (as at 30.06.2023): 1.96 billion USD
- Liabilities (as at 30.06.2023): 774 million USD
Analysts’ forecasts for Maplebear’s stock for 2023-2024
- In a comment to Business Insider, Wedbush expert Scott Devitt forecasted that Maplebear Inc.’s shares could reach the 28 USD mark and recommended them as a buy. The analyst believes Instacart will maintain its prominent role in the industry as a partner for retailers, thanks to the scale of its order fulfillment capabilities
- According to Webull, Piper Sandler analyst Alexander Potter rated the company’s shares as Overweight with a price target of 36 USD. In his opinion, Maplebear Inc.’s dominance in the delivery market will enable the company to deliver strong results in 2024
Technical analysis of Maplebear’s stock
The shares are moving to form a Double Bottom reversal pattern. The upper pattern boundary lies at 29.00 USD. Buyers need to gain a foothold above this level. This signal will likely indicate that the pattern has formed and could reach a potential target of 35.00 USD.
If the price finds a foothold above the descending trendline, this could serve as an additional signal in favour of a bullish scenario. This line was breached on 24 November 2023, possibly suggesting the end of the bearish trend. Another signal could be a breakout of the upper boundary of the Triangle pattern, within which the prices are moving at the time of writing.
A negative scenario for buyers might be a price decline below 23.40 USD. This could indicate that the Double Bottom reversal pattern will no longer be formed, and the bearish trend with lower targets will continue to develop.
Technical analysis of Maplebear’s stock*
3. IPO of Klaviyo Inc. – 576 million USD
Year of registration: 2012
Registered in: the US
Headquarters: Boston, Massachusetts
Sector: technology
Market capitalisation: 8.03 billion USD
Klaviyo Inc. (NYSE: KVYO), a software developer, held an IPO on 20 September 2023, with Goldman Sachs & Co. LLC, Morgan Stanley & Co. LLC, Citigroup Global Markets Inc., Barclays Capital Inc., and Mizuho Securities USA LLC as the largest underwriters.
Klaviyo Inc. sold 19.2 million ordinary shares at 30 USD per unit, with gross proceeds reaching 576 million USD. At the time of writing, its stock value is about 31.06 USD per unit.
On the IPO date, the company’s P/S multiple reached 15.59, while the average value across the sector stood at 9.46. This makes it possible to assume that the issuer is significantly overvalued, which is why further growth of its stock appears unlikely without favourable market conditions.
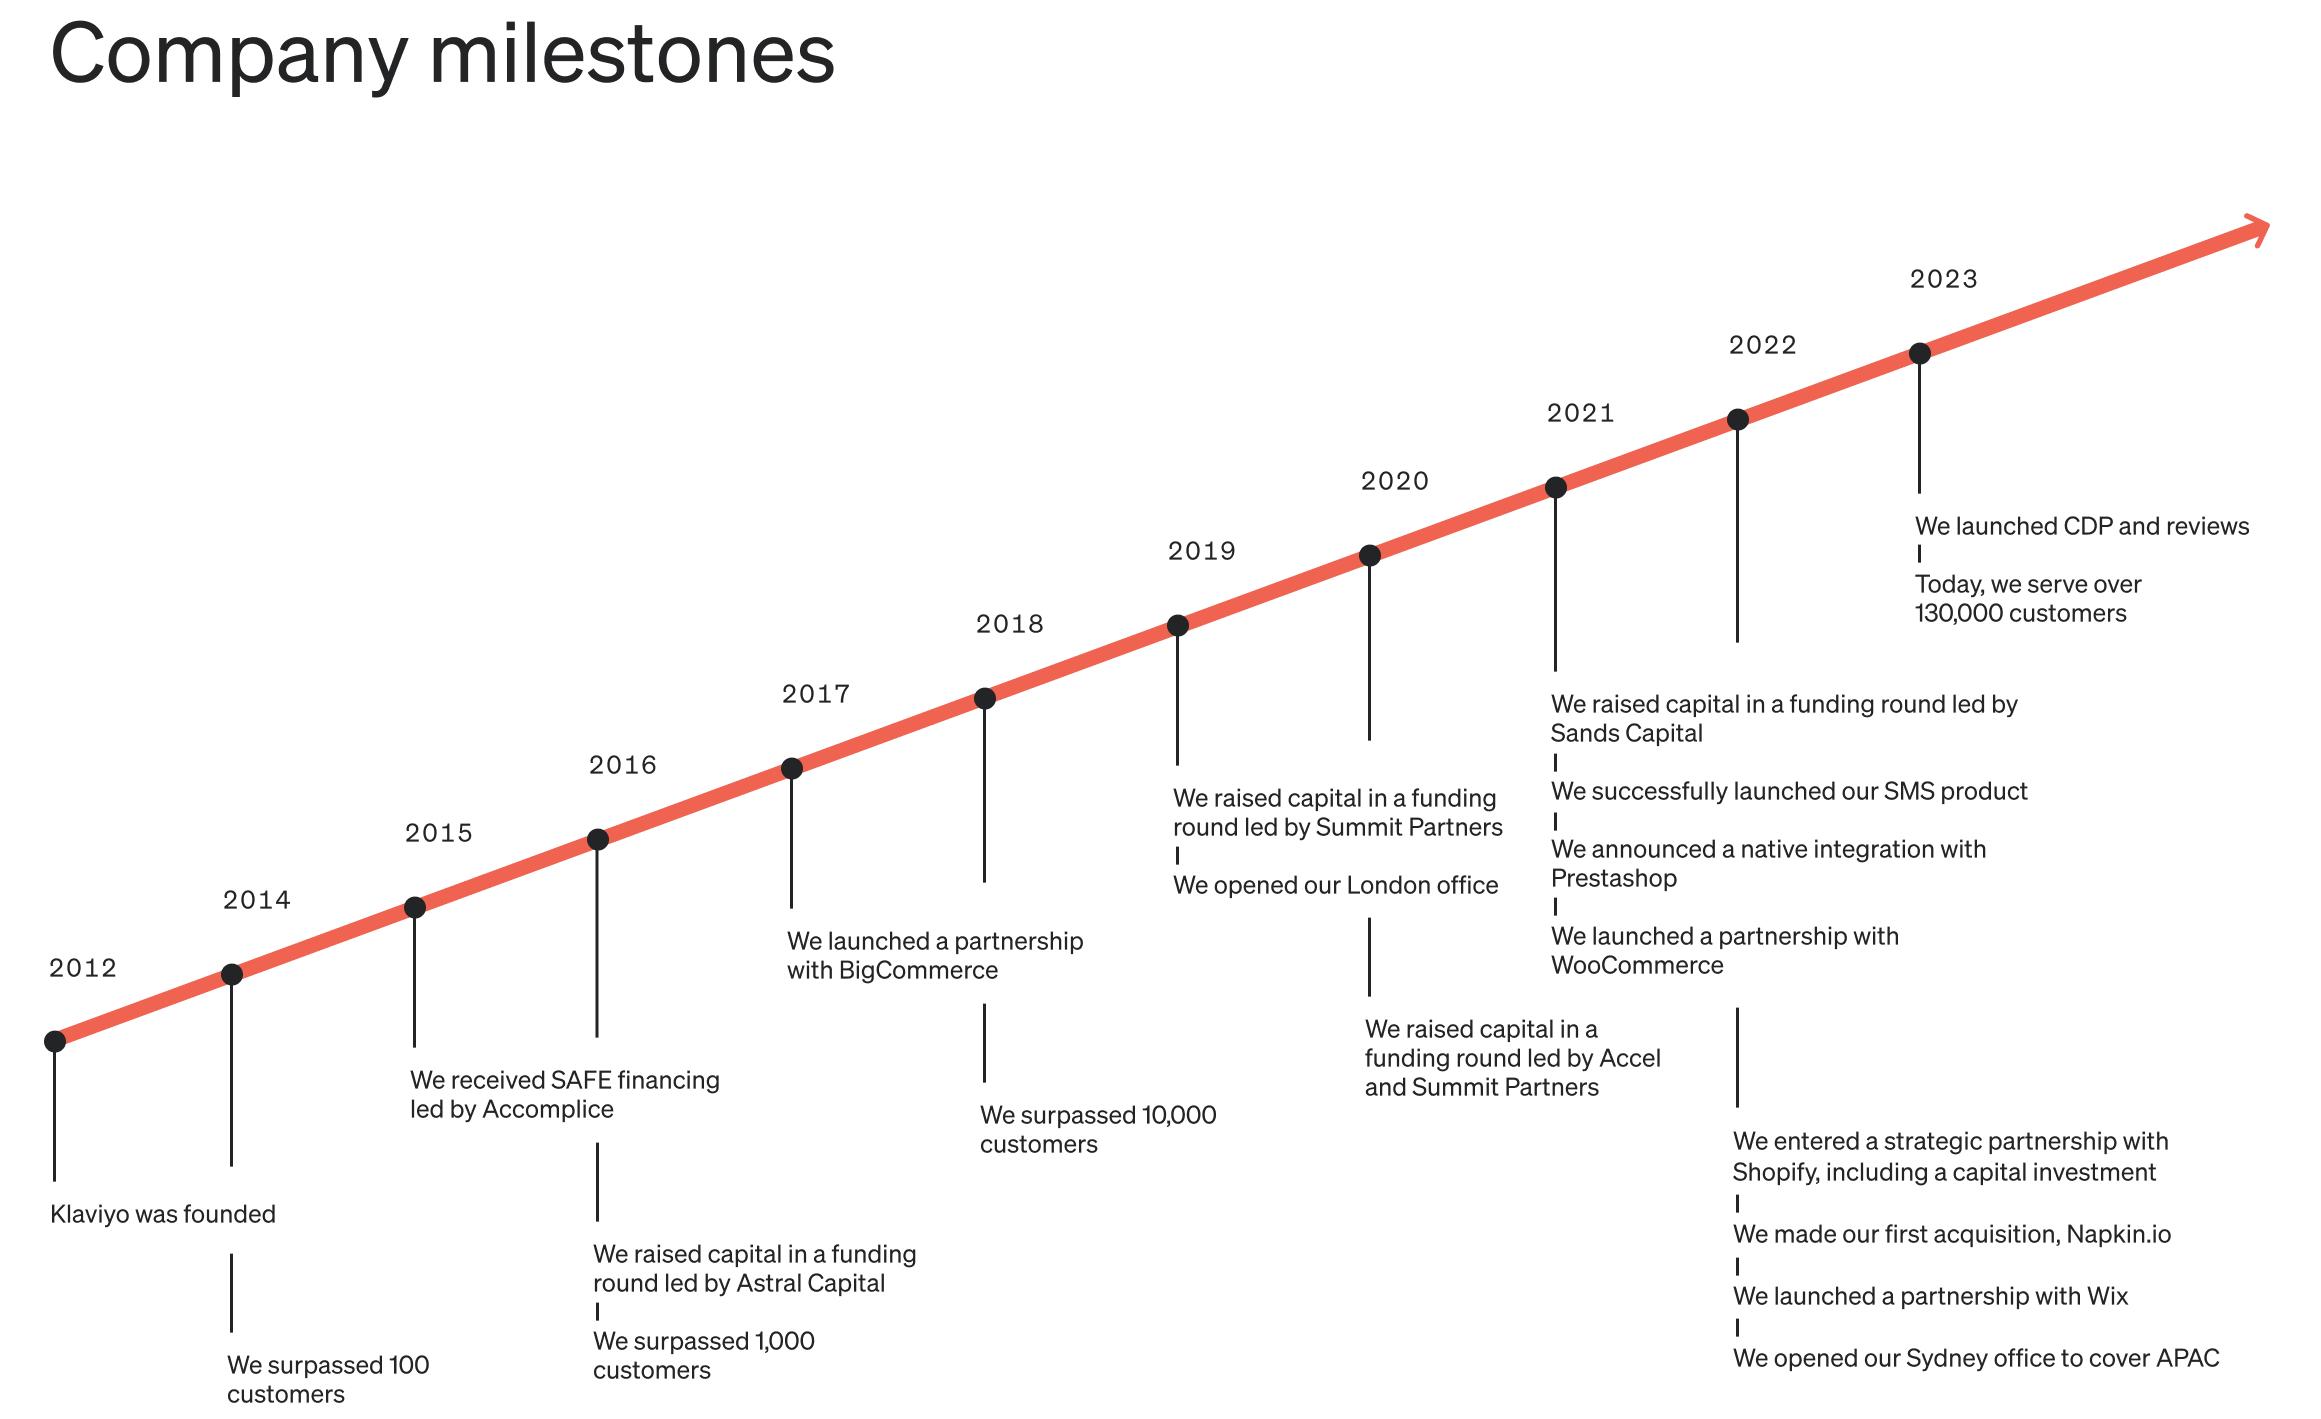
Investments raised (as at 30.06.2023) amounted to 455 million USD.
The main investors are Summit Partners L.P., Shopify Strategic Holdings 3 LLC, and Accomplice Fund I L.P.
Klaviyo market assessment
According to a report by Grand View Research, the global marketing automation market was valued at 4.06 billion USD in 2019. It could reach 8.6 billion USD by 2027, with a compound annual growth rate of 9.8% from 2020 to 2027 inclusive.
Klaviyo's primary competitors:
- Salesforce Inc.
- Oracle Corporation
- Adobe Systems Incorporated
- Braze Inc.
- Maropost Inc.
- Iterable Inc.
Financial performance of Klaviyo
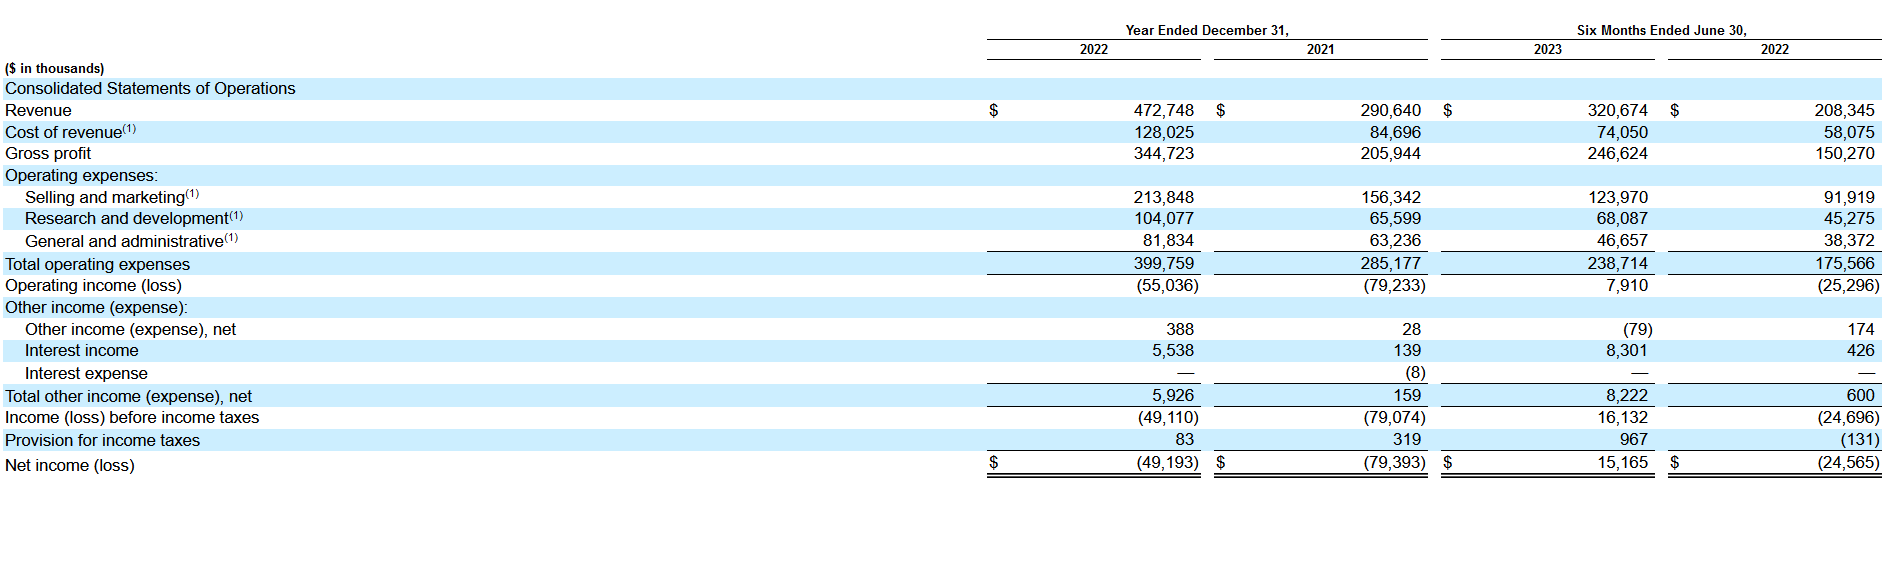
- Revenue for 2022: 472.75 million USD, +62.66%
- Net loss for 2022: 49.19 million USD, −38.04%
- Net cash flow (as at 30.06.2023): 57.03 million USD
- Cash and cash equivalents (as at 30.06.2023): 438.74 million USD
- Liabilities (as at 30.06.2023): 147.23 million USD
Analysts’ forecasts for Klaviyo stock for 2023-2024
- According to StreetInsider, Truist Securities Starts analysts set a Buy rating for Klaviyo Inc.’s stock with a price target of 42 USD. They believe that high demand for digital marketing services will enable the issuer to maintain remarkable revenue growth rates in 2024
- Based on StreetInsider data, Needham & Company experts assigned a Buy rating to Klaviyo Inc.’s shares and set a price target of 40 USD
Technical analysis of Klaviyo stock
Klaviyo Inc.’s quotes have been moving within a downtrend since 20 September 2023. However, on 24 November 2023, they broke the upper boundary of a Diamond reversal pattern. This might signal the end of the current bearish trend and potential growth to a 36.70 USD target.
If the quotes consolidate above the 32.00 USD level, this could serve as an additional signal in favour of a bullish scenario, likely to indicate a breakout of the upper boundary of the bearish channel. At the time of writing, the quotes are still testing the boundary of this channel.
Another signal confirming a price rise could be a rebound from the breached trendline on the RSI. In a negative scenario for buyers, the price might fall below 26.00 USD, potentially suggesting the resumption of the bearish trend and a stock decline to the next support level of 22.00 USD.
Technical analysis of Klaviyo stock*


Conclusion
The IPO market shows recovery signs in 2023 compared to 2022. According to Yahoo Finance, Goldman Sachs analysts predict this trend will persist in 2024.
They believe the US Federal Reserve will start lowering the interest rate next year, which could positively affect IPO market activity. As Bloomberg reports, several large private companies intend to go public in 2024.
As for 2023, the top 3 IPOs by the funds raised include Arm Holdings plc., Maplebear Inc., and Klaviyo Inc., with 4.87 billion, 660 million, and 576 million USD, respectively.
* – Past performance is not a reliable indicator of future results or future performance.
The material presented and the information contained herein is for information purposes only and in no way should be considered as the provision of investment advice for the purposes of Investment Firms Law 87(I)/2017 of the Republic of Cyprus or any other form of personal advice or recommendation, which relates to certain types of transactions with certain types of financial instruments.
The stock charts in this article are provided by the TradingView platform, which offers a wide range of tools for analysing the financial markets. It is a convenient, high-tech online market data charting service that allows users to perform technical analysis, research financial data, and communicate with other traders and investors.


 are complex instruments and come with a high
  of losing
  rapidly due to
  . 65.68% of retail investor accounts lose
  when trading
  with this provider. You should consider whether you understand how CFDs work and whether you can afford to take the high