How to Analyze Financial Reports of Companies by IFRS?

8 minutes for reading
In this article, we will discuss a step-by-step algorithm for analysing the reports of international public companies to enable you to examine them yourself. During the reporting period, investment recommendations and advice are overwhelming. To form an independent and correct opinion, you have to work with the primary source.
Where to begin?
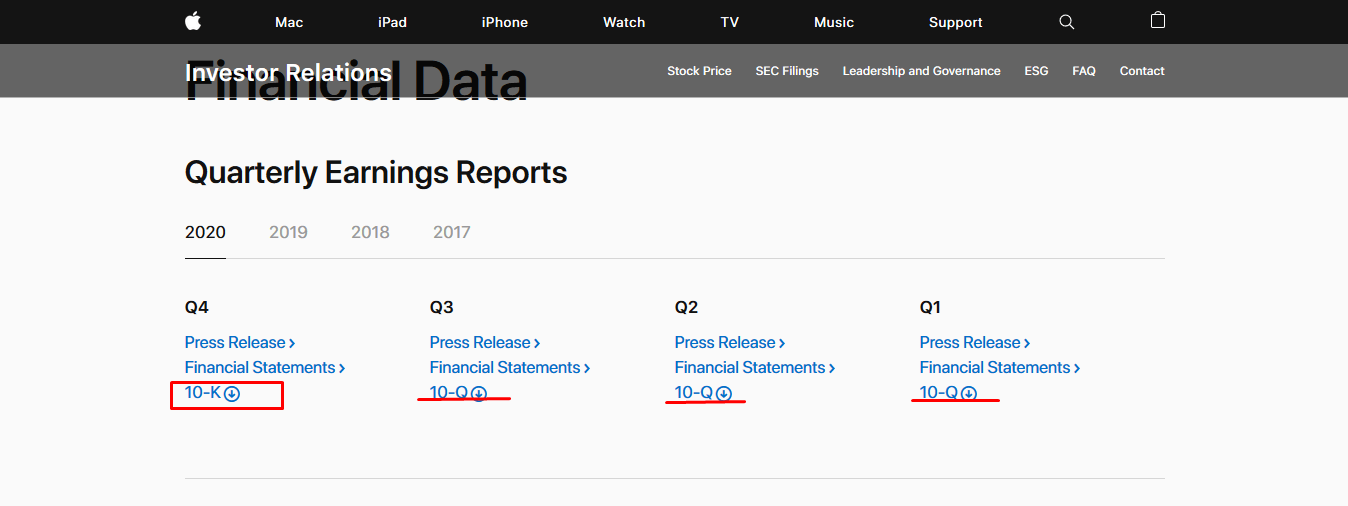
Start your analysis from the website of the company. You will find the reports in the section for investors. View an example in the screenshot below:

You can download all the reports of the company from the area dedicated to the financial reports in the investors' section of the website. Here, we have access to the yearly (10-K form) and quarterly (10-Q form) reports. We are more interested in the 10-K. Here below is an example:
If you are not keen on searching for all these sections on the websites of the various companies, simply go to the SEC regulator website, and download all the documents you are interested in from there. Enter the ticker of the company in the search form:

In the search results, select the 10-K form:


In the US, companies provide their reports according to the U.S. GAAP – the United States Generally Accepted Accounting Principles. The International Financial Report Standards (IFRS.org) do not differ much from them. We will therefore use U.S. GAAP hereafter.
Public companies provide regular investor reports, allowing us to analyse the key points of their performance. Now that we have found the reports, let's have a look at the most crucial elements.
Why is revenue important?
In the index of the form, we can view the structure of the report; part one contains general theoretical propositions about the company’s business. This part might be useful for a deep understanding of the branch of the economy.

Let's take Apple as an example: In the first part, its report contains a comparative analysis of an investment of 100 USD.

We see that five years after the investment, the sum would have turned into 424 USD, which is tangibly more than 325 USD – being the result of investing the same sum into the tech sector of the Dow Jones index. However, we are more interested in Item 6. Selected Financial Data.

Let's get started from the main thing – the dynamics of the company’s Revenue/Total Net Sales/Sales for five years. A positive signal is the growth of this index (as in the example). Mind the speed of the growth: if the latter slows down, look for the reasons.
Revenue is a characteristic of how rapidly the company captures the market. If you identify an issuer that will demonstrate stable revenue year by year, this will mean the company has found its niche and is focused on keeping it. To evaluate if the speed of revenue growth is satisfactory, compare it with the speed of the general market growth. For example, the shoe market is growing 5% annually, while the revenue of a particular shoe-making company has increased 10% every year. (…)
How to find the Net income and Dividends
To find the net income of the company (the difference between the revenue and operational expenses), go one line down:

This data represents the company's efficiency in managing corporate finance. It is the essence of the company’s existence. It should have an increase in net profit in the five years prior to the report. As we notice, Apple has not returned to the levels of 2018. Next, we will have a look at the company’s dividends:

Note that fast-growing companies at the stage of growth usually reinvest their income in their development and might not pay out dividends at all. Dividend payments are important for forming your investment portfolio, and not so much for making a profit on the growth of the stock price. When money is cheap in the current macroeconomic cycle, loss-making companies quite frequently carry out IPOs. In such cases, we should focus on the speed of decreasing losses.
Now, for the company’s debts.
What is a large debt?
All companies use borrowed money for their development. Companies tend to take out loans actively when the interest rates of the Central banks of developed countries are negative. To determine whether the company’s debt is large or not, compare it to the company's capital. Thus, we get the Debt/Equity (D/E) multiplier. To calculate the coefficient, we will need the Total Liabilities and Total Shareholders’ Equity.

In the example, Debt/Equity (D/E) is 3.95, which is acceptable for a tech company. The golden mean here is 1.5 – 60% in loan capital against 40% of the company’s money. For precision, look at the current liabilities.

They are less than two times larger than the company’s capital, which is acceptable. Meanwhile, if the company’s capital is larger than its debts, this means conservative or inefficient money management. Working with the debt market is both economics and art.
Also, we can compare the Total Assets and Total Liabilities of the company:

The amount of assets is larger than the liabilities, which means the risk of corporate default is low. If otherwise, check out the dynamics of growth of the debt and the assets. Anyway, investors should consider their risks before investing in such companies.
How to calculate P/E, P/S, and ROE out of a report
We can easily calculate a classical multiplier P/E – Price/Earnings (capitalisation vs net profit). For this, we need the net profit per stock and the market price of the stock. In Apple's case, the index is 119/3,31 = 35,95.

This means that the time required for this investment to pay off is almost 36 years. However, the problem with this index is that it does not account for future profits. Hence, nowadays investors actively buy stocks with high P/E. Using the report, we can calculate the average of this multiplier for five years. The result can be used for estimating whether the cost of the company is fair.
In the same way, we can calculate the P/S – Price/Sales multiplier (capitalisation/revenue). In our example, the index is 7,85 (2154/274,5), which means the market price of the company is equivalent to about eight yearly revenues. Then calculate the average of five years and estimate if the company is evaluated fairly.
The ROE (Return on Equity) is even simpler to calculate:
ROE = Net Income/Total Shareholders’ Equity*100%.
ROE = 57,411/65,339*100%= 87,87%.
This means that for every invested dollar, the owners will receive 88 cents in profit. There is no reference value for ROE – it is to be compared with the average of the last five years and the coefficient of competitors. In any case, an ROE of over 50% is almost always remarkable.
What are the best stocks to buy?
Summing up the above, we conclude that:
- The revenue must be growing.
- The net profit must be increasing.
- The assets of the company must exceed its liabilities.
- P/E and P/S must be lower than the average of the last five years.
- If the ROE is over 50%, place the stocks in a separate portfolio.
If you analyse the above-mentioned information from the primary source, you will have a better understanding of your investments.


 are complex instruments and come with a high
  of losing
  rapidly due to
  . 65.68% of retail investor accounts lose
  when trading
  with this provider. You should consider whether you understand how CFDs work and whether you can afford to take the high